- Users will easily adopt the app with a good UI/UX. Dissatisfied users revert to manual processes – just like 38% abandoning apps after poor first impressions.
- Top design performers, including the ones in the fleet management domain, achieve 32% higher revenue growth and 56% higher total shareholder returns.
- Fleet managers mention access to UI/UX design expertise among the top reasons for outsourcing their fleet app development projects.
- Mult-role logic is one of the key challenges in building UI/UX design for a fleet app. If the app is oriented toward different users, invest heavily in designing separate user journeys.
- The best practices for making a good fleet management software design include a clear hierarchy of components, a coherent experience across devices, and fast access to the most necessary features across roles.
Fleet management app design isn’t about visuals. It’s about whether people trust it enough to actually use it. Dispatchers, drivers, and other logistics specialists either use your app or quietly return to old-fashioned workflows.
When your solution’s UX fails, users don’t complain – they leave. A Forbes article on product branding and UI/UX design notes that about 38% of users abandon an app when it doesn’t meet expectations. In fleet ops, that “abandonment” just looks like WhatsApp threads and spreadsheets replacing the system entirely.
This article provides a working guide for product owners, PMs, and designers building or redesigning fleet apps. Here I’ll cover the 7 key challenges in fleet software, along with practical ways to solve them, based on 8+ years of experience in UI/UX design services and deep industry expertise.
Why is designing fleet management apps so hard?
Whether it’s a manager seeking predictive maintenance guidance, a driver looking for the best route, or a dispatcher keeping an eye on a delayed load, everyone uses the app differently. Balancing all those needs and workflows is what makes fleet management software design so challenging.
And the stakes are real. Design quality is a measurable business lever. In fact, McKinsey’s report on the business value of design reveals that top design performers achieve 32% higher revenue growth and 56% higher total shareholder returns. The World Usability Congress report shows that over 48% of executives across industries point to design experience as a key factor in business performance.
We also see this in the feet management software domain. A state of fleet management software research conducted by the Volpis team shows that access to UI/UX expertise not available in-house is cited as a significant benefit of project outsourcing by fleet companies. For a fleet product, the quality of its UI/UX design translates into adoption, retention of drivers and dispatchers, and the number of tickets your support team doesn’t have to answer.
The single biggest UX win we’ve shipped on fleet projects isn’t a new chart. It’s removing fields, screens, and notifications that no role actually uses. Subtraction beats decoration in fleet software, every time.
7 challenges in fleet management app design and the patterns that solve them

These problems aren’t theoretical. Each challenge below is one we’ve hit during fleet management software development projects, with the specific design pattern we use to get around it. Where it helps, I’ll point to how our team has solved it while working on different projects for real-world customers.
We helped a leading fleet software provider build a native mobile app for GPS fleet tracking and day-to-day fleet management. One of the biggest challenges was keeping it usable in real conditions – drivers don’t have time to dig through menus. So we focused heavily on UI/UX clarity, making sure key trip data, driver details, and the driver score dashboard are easy to read at a glance. If you want the full breakdown, check out the FleetSu case study.
Challenge 1: How to design a fleet app for mobile, web, and tablet without breaking it?

Short answer: Design the smallest screen first, as if it’s the only one, then build up. Most fleet apps fail the multi-device test because they’re designed on a 27″ monitor and squeezed onto a 6″ driver’s phone at the end of the sprint.
Fleet products are split across roles that live on different hardware. Drivers are on a phone, often mounted in a cab. Dispatchers and ops are on a desktop with two monitors. Yard supervisors are on a rugged tablet. A real-world fleet app needs to feel native on all three, on a weak signal, with gloves on, in sunlight.
The pattern that works:
- Mobile-first IA. Lock down the driver flow on a 360px screen first. If you can’t fit the action in a thumb-reachable zone, the rest of the product has the same problem.
- Role-aware navigation. The driver app exposes 3–4 destinations. The dispatcher web app exposes 6–8. The same component library, different surfaces.
- Offline-tolerant components. Forms, trip logs, and mobile vehicle inspection checklists should be committed locally and sync when the signal returns. Treat the network as optional.
- Touch targets at 44–48px minimum. Truck cab vibration, plus gloves, plus glare leaves no margin for tiny tap zones.
Rand One (Rand McNally’s hardware-free driver app) is a clean example. We designed it as a phone-first product that replaced a physical GPS fleet tracking device. All UI components in the app were designed for phone screens and real-world driving conditions. The solution was also adapted for tablets, since many drivers use them mounted horizontally in their cabs. The interface works seamlessly in landscape mode, keeping controls easy to reach and information clear regardless of orientation.
For a deeper take on the mobile side, explore the article on how mobile apps help in fleet management.
Challenge 2: How should fleet management dashboards present KPIs without overwhelming users?
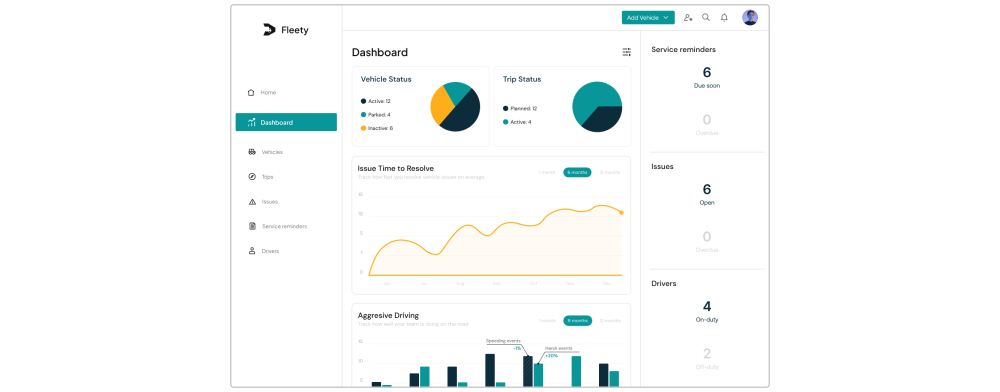
Short answer: Design each dashboard around the one question that role opens the app to answer. Everything else is a drill-down, not a tile.
The users are likely to be overwhelmed if they see 16 cards, 4 charts, a map, and a portion of sidenotes on the screen. Nobody is trying to convince you to delete such components completely. Instead, set a clear hierarchy of UI components.
The pattern that works:
- One hero question per role. Dispatcher: “What needs my attention right now?” Fleet manager: “How did we do this week?” Maintenance: “What’s due, and what’s overdue?”
- KPI triage in three tiers. Hero tile (1), context tiles (3–5), drill-down (the rest, one tap away).
- Color used semantically, not decoratively. Red is incident, amber is warning, green is healthy. Never use red on a chart just because you ran out of palette.
- Show the trend, not just the number. A KPI without a 7- or 30-day sparkline is a noun without a verb.
This is exactly how the Volpis team built the FleetSu Driver Score view. Our specialists kept the score and its 7-day trend as the hero, with daily trip statistics below for context. Anything deeper, like the full trip logbook, route maps, or raw events, lives a tap away. Drivers see the score they care about in under a second. This approach can serve as a foundation for creating a driver reward program because the app delivers accurate, specific, and measurable data for objective performance assessments.
| Role | Hero question | Right pattern |
|---|---|---|
Driver | How did I drive today? | Single score + trend + last trip |
Dispatcher | What needs my attention? | Alert digest + live map + assignable units |
Fleet manager | How are we tracking this week? | KPI grid + utilization + week-over-week deltas |
Maintenance lead | What’s due or overdue? | Service queue + parts/inspection alerts |
Owner | Are we hitting targets? | 5–6 portfolio KPIs + drill-down by depot |
If you can answer one of those questions in under three seconds without scrolling, the dashboard is doing its job. If not, cut it back.
Challenge 3: How to design a fleet app for drivers, dispatchers, and managers at the same time?

Short answer: Stop designing one app. Design one product with role-specific surfaces that share data, components, and rules but not screens.
Fleet products typically serve 4–6 personas: driver, dispatcher, fleet manager, maintenance lead, safety/compliance officer, and owner. They share data, but their jobs don’t share screens. A driver shouldn’t see a fleet-wide cost chart instead of tailored tips on driver behavior improvement. A fleet manager shouldn’t have to swipe past a “Start trip” button. Forcing a single, mixed view is the most common reason fleets stop using the app within 90 days.
The pattern that works:
- Persona-led IA. Map every screen to one primary role. If two roles share a screen, one of them is being underserved.
- Role-based home screens. Same login, different first screen. The product greets each role with their job, not a generic welcome dashboard.
- Permissions as a UX layer, not just a backend rule. Hide what a role can’t use. Don’t gray it out.
- Shared design system. Components, icons, and color rules stay consistent so the product feels like one thing, even if surfaces differ.
Sometimes, a working strategy is designing separate yet consistent and interconnected apps for different user categories. While working on the Rand One driver app, we built the that works as part of a bigger system. It perfectly aligns with the customer’s applications for managers and dispatchers. All apps work as part of a unified system, providing separate functionality and UI/UX designs tailored to different roles.
Challenge 4: Where does AI actually belong in fleet management UI/UX?

Short answer: AI earns its place in fleet UX when it answers “what should I do next?” It doesn’t earn its place by narrating data that the user could read for themselves.
The temptation is to bolt a chat box onto the dashboard and call it an AI fleet management solution. Fleet ops won’t use it. What they will use is AI that turns the firehose of telemetry into a short, ranked list of decisions, such as working strategies for reducing fleet downtime. A good application of AI in fleet management is not about generating insights. It’s about pruning them.
The pattern that works:
- Predictive alerting, not predictive paragraphs. “This vehicle is trending toward an inspection failure” beats “Here’s a summary of vehicle health.”
- Anomaly surfacing on the dashboard. Quietly promote unusual KPI movements to the top tile, with a confidence indicator.
- Natural-language search over trips and incidents. “Show me late deliveries last week with idle time over 30 minutes” beats a five-step filter form.
- Explainability over magic. If the model flagged a driver, show why. Surface the underlying events, not just a score – so you can actually see the patterns behind your AI fleet management system, not just a single summary number.
With its ability to reduce the workload of logistics coordinators by 10-20%, as noted by McKinsey, AI holds great potential for the logistics industry. The key point here is to apply it properly and make it usable for your employees. The broader story on AI’s role in fleet ops, including the parts that don’t touch UI, lives in my article on AI and ML in fleet management. The design rule of thumb stays the same: if the user can’t verify what the model said, the feature isn’t ready to ship.
Challenge 5: How to design a fleet app that handles huge volumes of data without breaking?

Short answer: Aggregate by default, drill down when needed, and don’t surface what no one asked for.
A 500-vehicle fleet produces millions of GPS points, plus hundreds of thousands of events, such as inspections, fuel efficiency monitoring logs, and maintenance updates, all of it flowing constantly. The problem isn’t missing data. It’s trying to show the whole thing at once on one screen.
The pattern that works:
- Pre-aggregate on the server. The UI requests “this week’s fuel by depot,” not raw trips.
- Virtualized lists and tables. Render only what’s in the viewport. Long fleet lists should scroll like a phone contact list, not a spreadsheet.
- Time-window defaults that match the role. Dispatcher = today. Fleet manager = this week. Exec = this month and YTD.
- Filters as first-class citizens. Filters that are saved per user, can survive a refresh, and can compose.
FleetSu’s trip logbook ships a clean version of this. While using the fleet mobile app, drivers see today’s trips up front; everything older is one filter step away. The same pattern scales whether the fleet has 5 vehicles or 5,000.
Tying the data layer to the right interface also supports compliance with industry standards, such as those enforced by the Federal Motor Carrier Safety Administration. At least, better UI/UX translates into more convenient fleet reporting and auditing. For more insights on this topic, read my guide to fleet compliance reporting.
Challenge 6: What does good navigation and search look like in a fleet app?

Short answer: If a dispatcher needs more than two taps or three words to find a vehicle, driver, or trip, your search is broken.
Fleet operators don’t browse. They look up. They land on the app with a vehicle number, a driver name, a trip ID, or a customer reference in their head, and they need it on screen in seconds. The right pattern collapses the IA around lookup, not exploration.
The pattern that works:
- Global search with type-aware results. “T-128” returns the truck; “Sara” returns the driver; “INV-9912” returns the trip.
- Recent + pinned. Most operators work the same 20 vehicles each week. Show them at the top.
- Voice and hardware shortcuts on mobile. Drivers shouldn’t be typing while driving. Voice-controlled fleet software supporting NFC taps should not be viewed as a novelty.
- Deep links. Every entity gets a URL. Pasting a vehicle link in a chat should land you on that vehicle.
FleetSu uses voice command integration and NFC vehicle detection so drivers can start a shift with a tap on a sticker and a quick voice prompt, with no typing. That’s the right level of friction for someone wearing work gloves.
Challenge 7: How to design fleet maps and real-time location tracking that operators actually use?

Short answer: The map is the most expensive screen in fleet software. Treat it like one. Cluster ruthlessly, render only what’s in view, and never make a dispatcher wait for the dots to load.
Maps are vital parts of any fleet management software as they support route optimization and fleet tracking. At the same time, they’re often where fleet UX starts to fall apart. Throw 500 vehicles on a Google Maps view, and you’ve shipped a slideshow. The fix is a hard split between live awareness (the map) and decision tools (everything besides the map). Check out my recent article to get tips on displaying a large number of objects on Google Maps in fleet management systems.
The pattern that works:
- Cluster by default at zoom-out, expand on zoom-in. Cluster counts should be legible, not 1px dots.
- Status before identity. A vehicle’s color should communicate its state (moving, idle, alert) before its label communicates which truck it is.
- Side rail for action. The map shows the location, and the side panel shows what needs attention and what to do next.
- Background location with battery rules. Match accuracy to the trip phase. Burn battery when it matters; conserve when it doesn’t.
FleetSo’s web platform is a good example of a solution with strong GPS fleet tracking features. The home screen centers on a live map with color-coded vehicle statuses, while dashboards, trips, and driver management tools support planning and decision-making. Dispatchers can monitor the fleet and take action without switching screens. This responsive layout works well on dual-monitor desktop setups where maps and controls sit side by side.
Fleet dashboard design patterns that work in 2026
Here are the patterns from the chapter above consolidated in one place. They aren’t the only ones that work, but they hold up across product types: vehicle telematics, transportation management system (TMS), maintenance, mixed fleets, and last-mile.
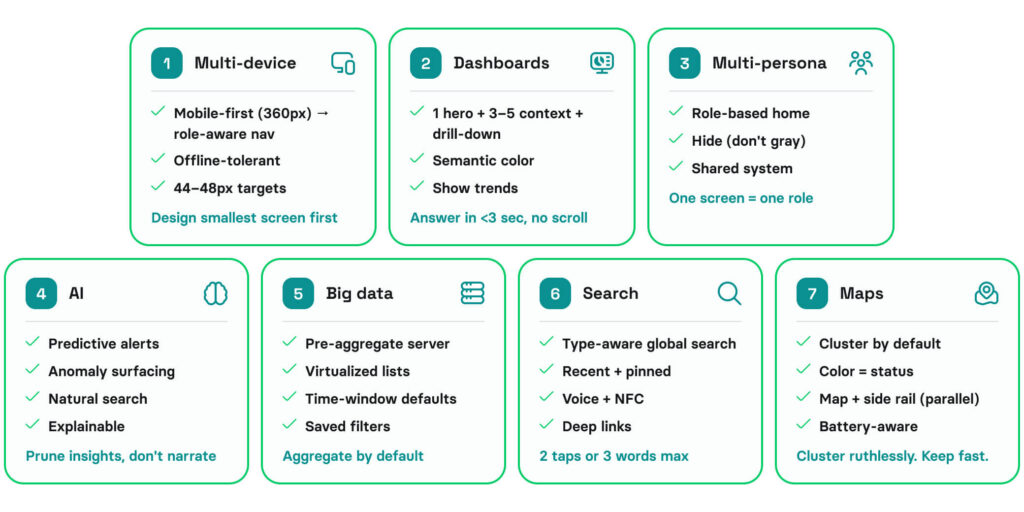
- Multi-device design. Mobile-first IA (360px). Role-aware navigation (driver: 3-4 destinations, dispatcher: 6-8). Offline-tolerant components. Touch targets 44–48px minimum. Rule: Design the smallest screen first.
- Dashboard KPIs. Hero tile (1) + context tiles (3-5) + drill-down. One hero question per role. Semantic color. Show trend, not just number. Rule: Answer the question in <3 seconds without scrolling.
- Multi-persona design. Persona-led IA. Role-based home screens. Permissions hide features, don’t gray them out. Shared design system underneath. Rule: Map every screen to one primary role.
- AI in fleet UX. Predictive alerting (not paragraphs). Anomaly surfacing on dashboard. Natural-language search. Explainability over magic. Rule: AI prunes insights, doesn’t narrate data.
- Large data volumes. Pre-aggregate server-side. Virtualized lists (render viewport only). Time-window defaults per role (today/week/month). Filters as first-class citizens. Rule: Aggregate by default, drill-down when needed.
- Navigation & search. Global search (type-aware results). Recent + pinned. Voice and NFC on mobile. Deep links everywhere. Rule: Two taps or three words to find anything.
- Fleet maps & location tracking. Cluster by default, expand on zoom. Status before identity (color = state). Map + side rail (parallel, not tabs). Battery-aware tracking. Rule: The map is expensive. Cluster ruthlessly. Keep it fast.
Each pattern starts with a role’s question, not a feature list. That’s the rule the Volpis team follows at the start of every redesign.
The best fleet dashboards we’ve shipped removed more tiles than they added. The win wasn’t visualization. It was the editorial decision about what shouldn’t be on the screen at all.
Final Word
The seven challenges in this article aren’t sequential – they’re interconnected. Solve role-based navigation, and dashboards get simpler. Solve data volume, and search gets faster. Good fleet UX is a system, not a checklist.
But here’s what matters: None of this is about the interface. It’s about whether operators trust the system.
Building trust requires a structured process. While the challenges overlap, the design work must follow a clear sequence – one that starts with users, not screens.
- Analyze user needs, define roles, and run additional competitor research.
- Conceptualize the solution using a customer journey per role.
- Create a design prototype and test the product in conditions that the product actually ships to.
- Build a visual design including key UI components.
- Evaluate your solution’s design using A/B testing, remote user testing with real drivers and dispatchers, and a feedback loop wired straight into the backlog.
Whether you’re scoping a new fleet product or untangling an existing one, our team has shipped the patterns above.
Let’s talk and discuss your fleet management software, along with its core design patterns.
Questions & Answers
FAQ
How can UX design improve the efficiency of fleet management tasks?
Good fleet UX cuts the number of taps and decisions per task. A well-designed dispatcher dashboard turns a multi-screen status check into one glance. A clear driver app turns a 90-second pre-trip into 20 seconds. Across a fleet, those seconds compound into real reductions in idle time, missed inspections, and dispatcher overhead.
What KPIs should a fleet management dashboard show?
The right KPIs depend on the role. A driver needs a safety or driver score with a trend. A dispatcher needs predictive maintenance alerts, on-time performance, unassigned loads, and driver behavior monitoring logs. A fleet manager needs utilization, fuel efficiency monitoring, maintenance compliance, and week-over-week deltas. Don’t show all of them to everyone.
How should a fleet app handle large amounts of data?
Aggregate on the server, virtualize long lists in the client, default the time window to match the role’s job, and make filters first-class: saveable, composable, and persistent. The UI should never render raw events. It should render decisions.
What does a good fleet management app design cost?
Geofencing creates a virtual boundary and triggers an action when a device crosses it – it is binary (inside or outside). Geotargeting delivers content based on general geographic location (city, zip code) without requiring boundary crossing. Geofencing is ideal for real-time proximity actions. Geotargeting suits broader campaigns like region-specific ads.
How is fleet management app design different from regular SaaS design?
Fleet products run on more device classes, in worse conditions, with more roles, on heavier data volumes, with safety and compliance consequences in the loop. The design rules of a SaaS dashboard still apply, but the margin for error is smaller. A glitch in a marketing app costs an unsubscribe. A glitch in a fleet mobile app can cost a missed delivery, or worse.
How do you get drivers and dispatchers to actually switch from spreadsheets and WhatsApp to a new fleet app?
Start with quick wins and role-specific design: drivers first, then dispatchers. Each should feel value immediately – 20-second pre-trips instead of 90, one screen instead of five tools. Logistics change management should treat the first 90 days as critical. Use peer champions, light onboarding, and minimal training. Build trust early. The fleet app replaces spreadsheets and WhatsApp, not adds more work. Then, prove it with side-by-side comparisons in the first weeks.