

Since July 7, 2026, every new vehicle registered in the EU must be fitted with an advanced driver distraction warning system. Drowsiness and attention warnings have been mandatory since 2024. Which means part of your fleet is now monitoring drivers whether you asked it to or not, and the rest of it is not.
That gap is the reason to build a driver behavior monitoring program deliberately rather than inherit one piece by piece. Done well, it lowers accident rates, fuel burn and maintenance spend, and gives you defensible evidence of how your drivers actually perform.
Regularly ranked among the Top Custom Software Development Companies on Clutch, our team at Volpis has spent years building custom fleet management software. In this guide I’ll cover what a driver behavior monitoring system tracks, how it works, how safety scores are actually calculated, how to roll one out in ten steps, and what the 2026 rules in the EU and US require of you.
What is a driver behavior monitoring system and why is driver data important?

A driver behavior monitoring system (DBMS) is technoa logy that tracks how your drivers handle the road – whether they’re speeding, braking too hard, taking sharp turns, or idling for too long.
This data is collected using telematics, sensors, and GPS to give fleet managers insights into driving habits. It helps ensure drivers follow safety rules, use fuel efficiently, and keep vehicles in better shape, all of which cut costs and keep the fleet running smoothly.
Monitoring driver behavior isn’t just about avoiding accidents. Risky driving can lead to hidden costs like legal fees, insurance hikes, and lost productivity. By collecting and analyzing driver data, fleet managers can spot patterns – like excessive speeding or harsh stops – and address them before they lead to bigger problems.
DBMS, DMS, ADAS and video telematics: how they overlap
Four terms are used interchangeably in vendor material. They are not four separate product categories, they are overlapping layers, and the useful distinction is what each one senses.
- A driver behavior monitoring system (DBMS) analyzes how the vehicle is being driven, from telematics feed: accelerometer, GPS and engine data.
- A driver monitoring system (DMS) senses the cabin. It tracks the driver’s eye movement, head position, and attention, usually through an in-cab camera, though drowsiness is sometimes inferred from steering input instead.
- ADAS (advanced driver assistance systems) sense the world outside the vehicle, using radar, lidar, and forward-facing cameras. Some only warn: forward collision warning, lane departure warning, blind spot monitoring. Others act on the controls, like automatic emergency braking and lane-keeping assist.
- Video telematics is not a peer of the other three. It is the delivery layer most fleets actually buy: a platform pairing road- and driver-facing cameras with the telematics feed, so a flagged event arrives with footage attached.
What data might be measured in the driver monitoring system?
A driver behavior monitoring system collects more than most fleets end up using. The table below covers what can be measured, what device does the measuring, and what threshold typically triggers an alert. The distinction that matters in practice is between metrics worth interrupting someone over and metrics that belong in a weekly report.
| Data measured | Description | Devices used | Typical alert threshold |
|---|---|---|---|
| Safety behaviors | |||
| Speed | Monitors if drivers are adhering to speed limits. | GPS, telematics devices | 8-10 km/h (5-6 mph) over the posted limit, sustained |
| Aggressive driving (acceleration & braking) | Detects rapid acceleration and harsh braking, which increase vehicle wear and fuel consumption. | Accelerometers, telematics devices | Around 0.3 g acceleration / 0.35 g deceleration for cars and vans; lower for heavy vehicles |
| Cornering | Identifies sharp or fast turns that indicate risky driving behavior. | Gyroscopes, accelerometers | Around 0.4 g lateral for cars and vans; around 0.25-0.3 g for heavy vehicles |
| Lane discipline | Monitors if drivers maintain lane positioning or perform unsafe lane changes. | Cameras, lane departure sensors | Lane departure without turn signal |
| Distracted driving | Detects signs of distraction, such as phone use or lack of attention. | In-cab cameras, driver monitoring sensors | Eyes off road beyond ~2 seconds at speed (vendor-configurable; aligns with NHTSA glance guidance) |
| Fatigue detection | Identifies driver fatigue through eye closure, yawning, and head position. | In-cab cameras, fatigue monitoring sensors | Any occurrence, escalate immediately |
| Seat belt usage | Monitors if drivers are wearing seat belts. | Seat belt buckle switch (via CAN / J1939), in-cab cameras | Any occurrence above ~10 km/h |
| Tailgating detection | Monitors if a driver is following another vehicle too closely. | Forward-facing cameras, radar, computer vision | Under 2 seconds is a passenger-car default, see note below |
| Collision detection | Detects potential or actual collisions and provides data for post-incident analysis. | Impact sensors, accelerometers, cameras | Any occurrence, automatic escalation |
| Compliance | |||
| Stop sign violations | Logs when drivers fail to stop at designated stop signs. | GPS, telematics devices | Any occurrence |
| Excessive overtime driving | Tracks how long drivers are on the road without sufficient breaks. | Telematics devices, driver activity sensors | Set by HOS rules in your jurisdiction |
| Speeding in specific zones | Monitors speeding in restricted zones, such as school or construction areas. | GPS, geofencing systems, speed sensors | Any occurrence over the zone limit |
| Operations | |||
| Idling time | Tracks how long the vehicle is idling, leading to wasted fuel and increased emissions. | Telematics devices | 3-5 minutes stationary with the engine running |
| Fuel consumption | Tracks how efficiently fuel is used, considering driving behaviors and route choices. | Telematics devices, fuel sensors | Reported, not alerted |
| Route adherence | Ensures drivers stick to planned routes and avoid deviations. | GPS, telematics devices | Deviation beyond a set radius or time |
Not every metric in this table directly affects a carrier’s CSA standing. FMCSA’s Safety Measurement System uses specific roadside inspection violations, state-reported crashes, and investigation data to calculate carrier performance across seven BASICs. Telematics and video data can help fleets identify and correct the behaviors that lead to those violations, but a telematics event does not itself become a CSA violation or a score. A harsh cornering event is a signal to coach on, not a point against you.
Thresholds are configurable and every platform ships with its own defaults. The values above are typical starting points, not standards, set your own from a baseline period (see Step 1) rather than accepting vendor defaults unexamined.
Two thresholds need more context than a table cell allows. Harsh-event thresholds depend on vehicle class and load: a figure that flags aggressive driving in a van will either miss events or fire constantly in a loaded tractor-trailer, and vendors ship different defaults for each class. And following distance: under 2 seconds is a common vendor alert default, but it is a passenger-car figure. Standard CDL guidance for commercial vehicles is roughly one second for every 10 feet of vehicle length, plus one more second above 40 mph, which puts a typical tractor-trailer closer to 6 or 7 seconds at highway speed.
A word of warning before you switch everything on. If all fifteen metrics generate alerts, dispatchers stop reading alerts within a week. Start with alerts on the four or five safety-critical metrics and leave the rest in weekly reports, which is what the “reported, not alerted” entries above are doing.
Worth noting what this list actually is: in an employment relationship, in-cab cameras, fatigue detection, and distraction monitoring are all processing personal data about your drivers. Step 9 covers what that means legally in the EU and the US.
Together these give a fleet manager enough to see where risk actually sits and to act on it.
How a driver behavior monitoring system collects and processes data
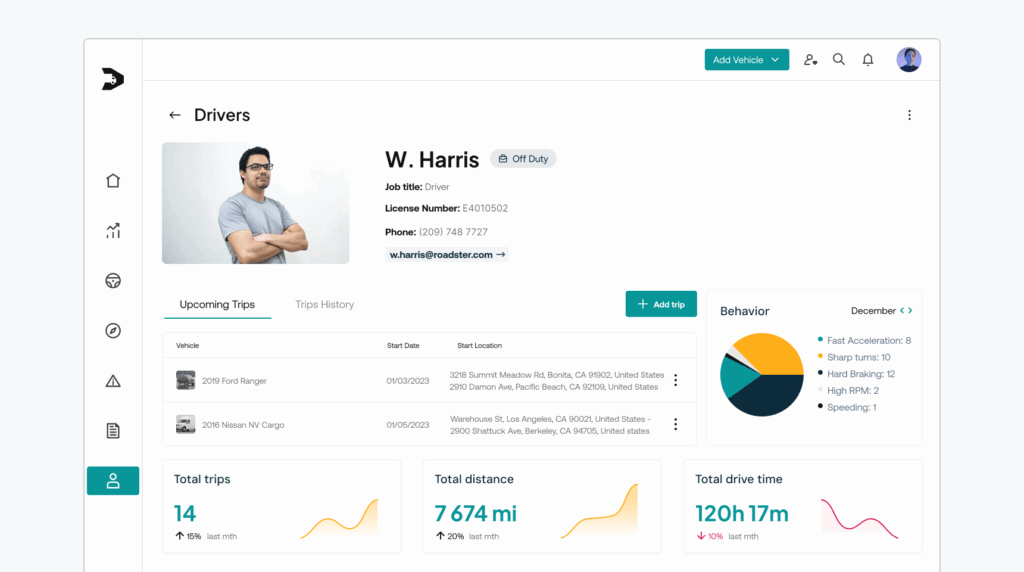
Three stages take raw sensor data and turn it into something a fleet manager can act on.
Data collection
The DBMS collects data from telematics devices, GPS and sensors fitted to your vehicles: braking, acceleration, speed, location and route.
Data transmission
The collected data gets sent to a central platform, usually in the cloud, where it’s processed and analyzed. Sometimes, the system does a bit of processing locally before it’s uploaded.
Driver performance analysis
The system evaluates driver behavior against the thresholds you set, flags events such as speeding or harsh braking, and produces a safety score for each driver.
How a driver safety score is calculated
Almost every platform produces a driver safety score, and almost none of them explain how. The mechanics are worth understanding, because that number is what your coaching conversations, bonus decisions and insurance negotiations will rest on.
Most scoring engines work the same way. Start from a baseline, usually 100. Detect events across the tracked behaviors: harsh braking, rapid acceleration, harsh cornering, speeding, and, where cameras are fitted, distraction and seat-belt violations. Give each event type a weight reflecting how strongly it predicts a crash; a distraction event normally costs more than a single hard brake. Subtract the weighted events from the baseline.
The step that separates a fair score from a useless one is normalization. Raw event counts punish whoever drives the most. A usable score is expressed per distance driven or per hour behind the wheel, so a driver covering 4,000 km a month is not automatically ranked below one covering 800. Vendors that publish their methodology, such as Samsara, normalize against both distance and time, and let fleets adjust the weight of each behavior.
The difference this makes is easier to see than to describe. Put your own numbers in below.
Try it with your own numbers
Driver safety score calculator
Enter one month of events for two drivers. The calculator shows the raw score most fleets look at, and the same score normalized by distance driven.
Adjust the weights
Weights are illustrative. Vendor defaults are built for an average fleet, and a refrigerated long-haul operation should not be scoring the same behaviors as an urban delivery fleet. Re-weighting these for your own operation is part of the setup, not an optional extra.
Simplified model for illustration. Production scoring engines add event severity, camera-validated context, and a rolling window, and they do not replace human judgment about drivers.
A worked example
Take two drivers over one month, scored with typical weights: harsh braking 2 points, speeding 3, distraction 5.
| Metric | Driver A (long-haul) | Driver B (urban delivery) |
|---|---|---|
Distance | 4,000 km | 800 km |
Events | 6 harsh brakes, 2 speeding, 1 distraction | 4 harsh brakes, 1 speeding |
Raw penalty | 6×2 + 2×3 + 1×5 = 23 | 4×2 + 1×3 = 11 |
Raw score (100 minus penalty) | 77 | 89 |
Penalty per 1,000 km | 23 / 4.0 = 5.75 | 11 / 0.8 = 13.75 |
Normalized score (100 minus 2x rate) | 88.5 | 72.5 |
On raw counts, Driver B looks safer: 89 against 77. Normalize by distance, and the ranking flips, because Driver A produces less than half the risk per kilometer driven. Every fleet that ranks on raw counts is making this exact mistake, just less visibly.
One caution before anyone coaches Driver B: the honest comparison is B against other urban drivers, not against a highway run. Weights and the doubling factor above are illustrative, in line with the caveat that vendor defaults have to be reweighted for your own operation.
Over what period is the score calculated? Most platforms use a rolling window of 30 to 90 days, with recent events weighted more heavily than older ones, and events dropping out entirely once they age past the window. Get this wrong, and a single bad Sunday follows a driver for six months, which is the fastest way to make the whole program lose credibility.
Where scoring goes wrong
Four failure modes account for most of the scoring programs that quietly stop being used. Each has a fix that costs less than the problem.
- Route type is ignored. Urban and last-mile routes generate far more braking and cornering events than highway run, for reasons that have nothing to do with the driver. If your highest-scoring drivers all happen to work the easiest routes, the score is measuring routes, not driving. Fix: compare drivers within cohorts of similar routes, not across the whole fleet.
- Weights are left at default. Vendor defaults are built for an average fleet. A refrigerated long-haul operation and an urban delivery fleet should not be scoring the same behaviors identically. Fix: re-weight for your own operation within the first 60 days, once the baseline shows what your fleet actually generates.
- False positives are not filtered. An evasive brake to avoid a collision looks identical to careless braking in accelerometer data alone. Context is what separates them: footage, following distance, whether another vehicle cut in. A system that cannot tell will penalize the drivers who avoided crashes. Fix: require video-based event classification from the vendor, not accelerometer-only detection.
- The score is used punitively before drivers understand it. A score nobody can explain is a score nobody trusts, and it will cost you drivers. Fix: publish the calculation before the score affects anything.
Any measured metric eventually gets optimized. Drivers learn what the system counts and adjust to the metric rather than to safety: coasting through a junction to avoid registering a hard brake, when braking hard was the correct thing to do. A score that can be gamed is worse than no score, because it produces the appearance of control while the underlying risk is unchanged. The defense is the same one that applies to any goal-setting system: measure outcomes alongside behaviors, rotate what you emphasize, and treat a suspiciously perfect score as a question rather than an achievement.
Validation, and who gets to act on the score
A score is only as fair as the events behind it, which is why sensor-detected events should pass through video-based classification before they touch the score. Drivers need a dispute window, and an event overturned on appeal must come off the score retroactively. An appeals process is not bureaucracy. It is the mechanism that makes drivers trust the number.
AI belongs on the event side of that pipeline, not the decision side. Use it to classify footage, filter false positives, and attach context. That is where it reduces the number of events a driver has to dispute. But the score informs decisions about people, it does not make them. Under GDPR Article 22, decisions with legal or similarly significant effects, such as termination, discipline, or pay, cannot rest solely on automated processing. This is settled practice rather than theory: in April 2023 the Amsterdam Court of Appeal ruled against Uber and Ola over automated decisions affecting drivers. A safety score can put a coaching conversation on the calendar. It should never be the thing that ends someone’s employment on its own.
On the insurance side, what carriers actually price is not the score itself but the process behind it. A documented coaching workflow, an appeals route, and evidence that low scores lead to action are what earn a discount, because they are what change the loss ratio. A high fleet average with no process behind it is just a number in a spreadsheet.
Top 7 benefits of driver behavior monitoring systems for fleet management
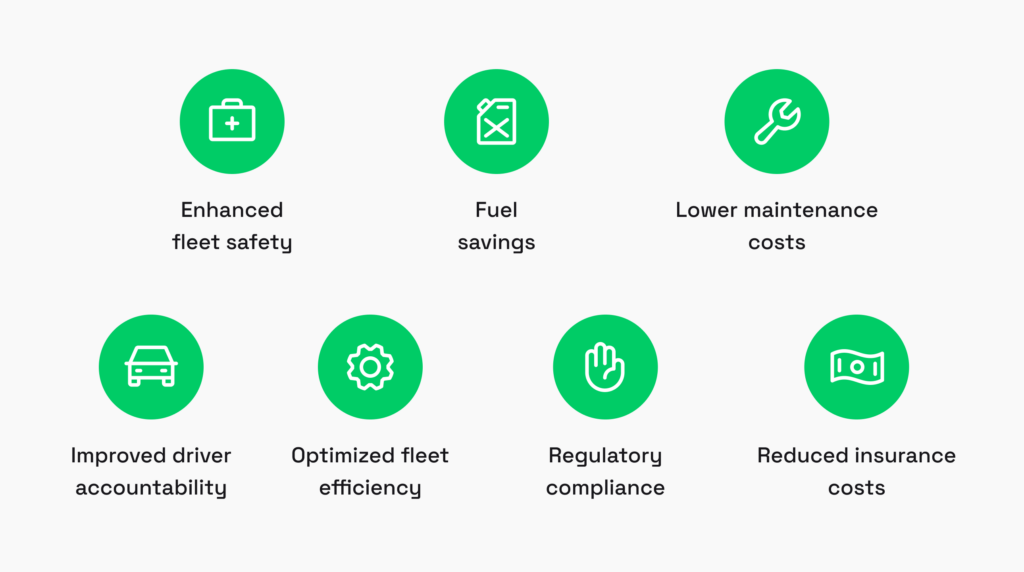
Drivers are the people your safety numbers are actually about. A monitoring system does not manage them. It gives you and them the same view of what is actually happening on the road, which is what makes the conversation about improvement possible at all.
Here is what fleets get out of that, and how to measure each one honestly.
Benefit 1: Enhanced fleet safety
DBMS helps fleet managers spot and fix unsafe driving habits. By keeping an eye on things like speeding, hard braking, and distracted driving, it makes sure drivers stick to safety rules, cutting down on accidents and injuries.
How to measure it: preventable incidents per million kilometers driven. Use a rolling 12-month window rather than a monthly figure; most fleets do not accumulate enough distance for a month to mean anything. A 50-vehicle fleet covering 50,000 km per vehicle per year produces around 200,000 km a month, which at typical collision rates is well under one preventable event. Track leading indicators monthly (harsh events and speeding per 1,000 km, which move in weeks) and treat the incident rate as an annual outcome measure.
Benefit 2: Fuel savings
Aggressive acceleration, sustained speeding, and idling all burn fuel that smoother driving does not. A monitoring system makes that visible per driver, which is what makes it coachable.
Savings vary widely with vehicle type, route mix, and how bad the starting point was, so treat any single headline percentage with caution. Measure your own baseline instead.
How to measure it: liters per 100 km (or mpg) per driver, compared year-over-year for the same month rather than before-and-after, because a comparison that runs from autumn into winter will show your program making fuel economy worse. Cold-weather penalties, payload, terrain, and traffic density all move this number more than coaching does, so for heavy fleets, normalize by work done (liters per 100 tonne-km) and pull consumption from the engine ECU rather than fuel-card data alone.
Benefit 3: Lower maintenance costs
Rough driving, like slamming on the brakes or speeding, wears out vehicles faster. By catching and fixing these habits, you can cut down on repair costs and make your vehicles last longer.
How to measure it: maintenance cost per kilometer, not per vehicle. Per-vehicle figures penalize whichever truck covered the most ground, which is the same normalization mistake described in the scoring section above. Split repairs into behavior-linked systems (brakes, tires, clutch, driveline, suspension) and everything else, using ATA VMRS codes so the split holds up when someone challenges it, and attribute only the first group to driving. Be patient with it: on many duty cycles, brake and tire intervals take 18 to 36 months to give a clean year-on-year read, and fleet age mix, duty cycle, and vehicle replacement will all move the number more than coaching does. For a faster signal, track unplanned downtime hours and roadside breakdowns per 100,000 km; they respond sooner and cost more.
Benefit 4: Improved driver accountability
When drivers know they’re being watched, they’re more likely to drive safely and responsibly. This means fewer accidents, less damage, and a win-win for both the drivers and the company.
How to measure it: accountability is a management loop, not a driver trait, so measure the loop. The share of flagged events that actually get reviewed, the median time from event to coaching conversation, and the repeat-offense rate within 30 days will tell you more than any driver-level number. Keep an eye on the spread between your best and worst scores alongside them. A narrowing spread means coaching is reaching the whole fleet; a widening one means it is landing with some drivers and not others.
Benefit 5: Optimized fleet efficiency
DBMS gives you real-time updates on where your vehicles are, how fast they’re going, and if they’re sticking to their routes. This helps you fine-tune routes, speed up deliveries, and boost overall efficiency.
How to measure it: idle time as a percentage of engine hours, and time over the speed limit as a share of driving time. Both respond to coaching within weeks. On-time delivery is worth tracking, but do not attribute it here: it is driven by route planning, loading delays, and customer dwell time far more than by driving, and claiming it as a monitoring outcome will not survive scrutiny from anyone who runs dispatch.
Benefit 6: Regulatory compliance
For fleets in industries with tight safety regulations, DBMS helps keep things compliant. It provides proof of safe driving and helps meet legal and industry standards.
How to measure it: your Unsafe Driving percentile in the FMCSA Safety Measurement System, which is fed directly by behavior data. Violations per inspection are worth watching but read noisier, since it depends on how many inspections you happen to draw.
Benefit 7: Reduced insurance costs
Many insurers give breaks to fleets using DBMS because it lowers accident risks. Evidence of a working safety program gives you something to negotiate with at renewal.
How to measure it: premium alone will mislead you, because rates move with the market cycle regardless of how your fleet drives. Ask your broker for the benchmark rate movement for your class and region, and track your renewal change minus the market change. That difference is the part you earned. The metric worth reporting upward is total cost of risk per million kilometers: premium plus retained losses and deductibles plus claims administration. Track claims frequency and average claim cost separately, since frequency responds to coaching and severity mostly does not.
10 proven steps to implement a driver behavior monitoring system for your fleet
A driver behavior monitoring system gives you the tools to track what’s happening on the road in real-time. Here’s a breakdown of how to get started with implementing your own DBMS.
Step 1: Set your objectives
Before you even start shopping around for hardware or software, take some time to nail down exactly what you want to achieve with a DBMS. Common goals might include:
- Safety: Cutting down on risky behaviors like speeding and harsh braking.
- Efficiency: Reducing fuel consumption by promoting smoother driving.
- Accountability: Ensuring drivers are where they’re supposed to be and aren’t misusing company vehicles.
Once you have clear goals, think about what metrics will help you track progress. Some of the most popular ones include speeding, harsh braking, sharp turns, and distractions (like phone use or drowsiness).
Then resist the urge to set targets straight away. Run a two-to-four-week baseline first, with the system recording but no thresholds enforced and no scores published. You need to know what normal looks like in your fleet before deciding what unacceptable looks like. Targets built on vendor defaults or guesswork end up either unreachable or meaningless. Start with three to five metrics and add more once those are under control.
Step 2: Choose your hardware

Most setups include GPS trackers, accelerometers, cameras and a device on the vehicle diagnostics port: OBD-II on light vehicles, or J1939 through a 9-pin Deutsch connector on heavy trucks and buses. Those are different connectors carrying different data, so confirm which one your fleet needs before ordering anything. It is important to pick hardware that is compatible with your fleet and reliable in capturing real-time data.
One thing that has changed recently: vehicles registered in the EU from July 2026 arrive with a distraction and drowsiness warning system already fitted (see Step 9). What that means in practice varies by manufacturer. It may or may not be camera-based, and it may or may not expose a data feed you can pull into your own platform, so ask at procurement rather than assuming the coverage is there.
Step 3: Pick the right software
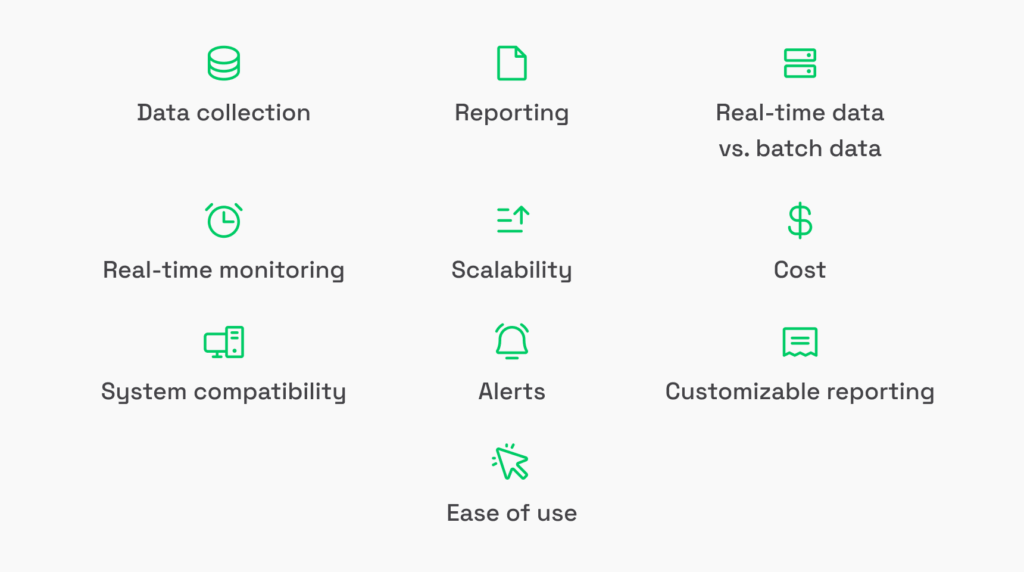
The software you choose is just as important as the hardware. Make sure it covers data collection, real-time monitoring, alerts, reporting, scalability, system compatibility, customizable reporting, ease of use, and total cost.
Off-the-shelf or custom? Off-the-shelf gets you running in weeks at a predictable cost per vehicle per month, and it is the right answer for most fleets whose requirements are close to standard. Building custom starts to make sense when one of these is true:
- You need behavior data inside systems you already run (dispatch, ERP, maintenance, payroll) rather than in a separate dashboard nobody opens.
- You want to own the raw event data rather than access it through a vendor API on the vendor’s terms.
- Your scoring logic needs to reflect something specific about your operation that no default model captures.
- Per-vehicle subscription costs at your fleet size have overtaken what building and running your own would cost.
Three questions worth asking any vendor before signing: can we export raw event data, not just reports? Is there a documented API? What happens to our historical data if we leave?
Step 4: Set up the telematics

Telematics is the backbone of a DBMS; it collects and sends the data from your vehicles to the software platform. Here’s how to get started:
- Install the hardware: set up your GPS trackers and diagnostic port devices in each vehicle.
- Connect the hardware to the software: Make sure your hardware is feeding data to the DBMS platform, whether through cellular networks or Wi-Fi.
- Configure the data flow: Ensure the system has a continuous data stream that you can monitor in real-time.
Step 5: Create feedback loops for driversrs
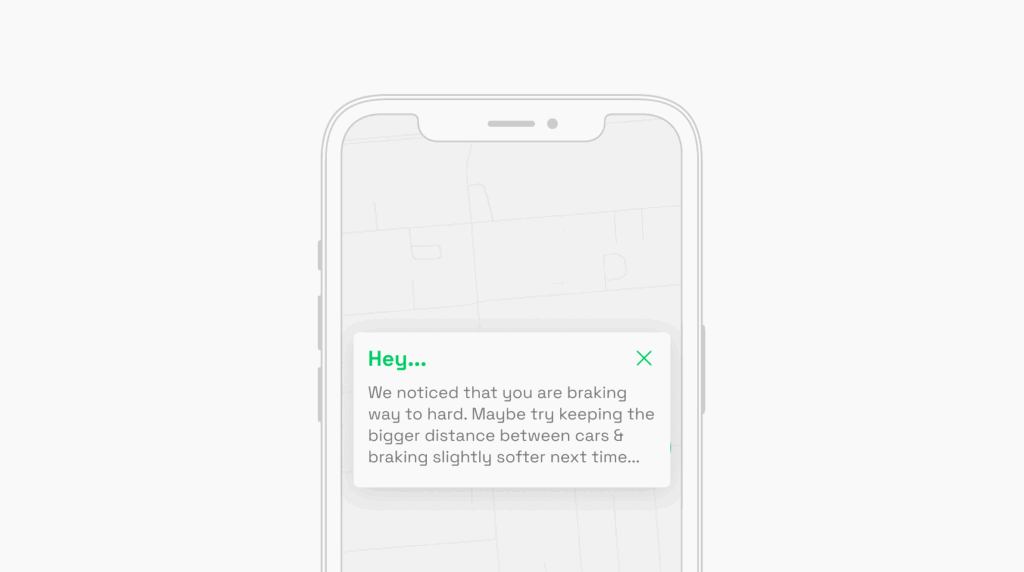
One of the best things about a DBMS is the ability to provide immediate feedback to drivers, helping them adjust their habits on the fly. Here’s how you can do it:
- In-cab alerts: Audible beeps or voice alerts can notify drivers when they speed or brake too hard.
- Driver apps: Many platforms have companion apps where drivers can see their performance stats at the end of each shift.
- Regular reports: Send out weekly or monthly summaries so drivers can track their progress and see where they need improvement.
This feedback not only improves driving behavior but also boosts accountability.
Step 6: Set up a driver scoring and reward system

To motivate your drivers to improve, set up a scoring system that ranks drivers on the behaviors you actually want to change. Most fleets start with three:
- Number of speeding incidents.
- How often they brake hard.
- Smoothness of cornering and acceleration.
Whatever you tie to the score, make sure drivers can see how it is calculated and challenge an event they think is wrong. An appeals route costs you very little and it is the difference between a program drivers accept and one they resent.
Step 7: Analyze data and make adjustments
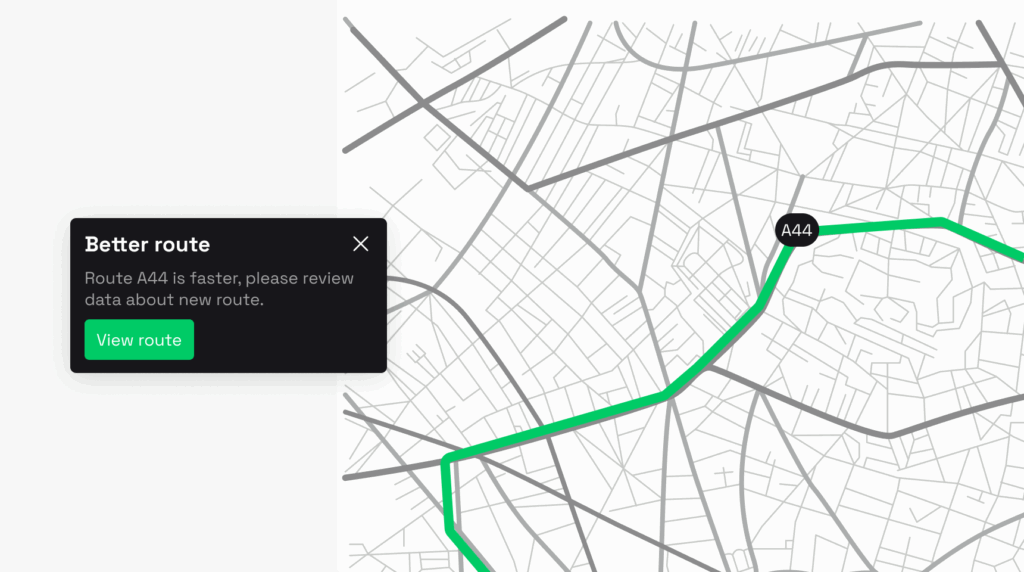
Once the system is running, you will accumulate more data than anyone can review manually. Use this to fine-tune both your DBMS and your fleet operations:
- Look for patterns: Are certain drivers consistently showing risky behaviors? Are some routes causing more problems than others?
- Optimize routes: You may be able to use data to choose more efficient routes, which saves time and fuel.
- Create reports: Regular reports will help you track how well your drivers are improving over time.
Step 8: Train drivers and managers
A monitoring system produces nothing useful if the people around it do not understand what it measures.
- Driver training: Explain how the system works, what data is being collected, and how they can improve their scores.
- Manager training: Teach fleet managers how to interpret data, give effective feedback, and manage alerts.
Ongoing training ensures your system is working to its full potential.
Step 9: Follow privacy and legal regulations

You are collecting data about employees, and in 2026 the rules governing that got considerably more specific. What follows is not legal advice, and your own jurisdiction may differ, but these are the frameworks that most affect fleets right now.
Before the details, the short version. Four sets of rules apply at once:
- What equipment EU vehicles must now have.
- What in-cab AI is allowed to infer about a driver.
- What you may collect about employees and on what basis.
- US safety and privacy rules, if you operate there.
Drivers should be told what is collected, why, who sees it and for how long, before the system goes live. That obligation is separate from your lawful basis for collecting it, and the two are often confused: informing drivers is mandatory, but their consent is generally not what makes the processing lawful in an employment relationship.
EU: driver monitoring is now mandatory equipment
Under the General Safety Regulation (Regulation (EU) 2019/2144), driver drowsiness and attention warning (DDAW) systems have been required on all new vehicles registered in the EU since July 2024. Advanced driver distraction warning (ADDW) systems became mandatory for new vehicle types in July 2024 and for all new vehicles registered from July 7, 2026. In practice: every vehicle you buy from now on arrives with a factory-fitted distraction and drowsiness warning system while your existing fleet does not. What that system actually is varies by manufacturer, and whether it exposes data you can use varies too, so plan for a mixed fleet rather than a uniform rollout.
EU: where in-cab AI cameras cross the line
The EU AI Act prohibits AI systems that infer emotions from biometric data in the workplace. The ban has applied since February 2, 2025, and carries penalties of up to €35 million or 7% of global annual turnover, and employee consent is not a defense. The prohibition applies regardless. The exemption is narrow but directly relevant here: detecting physical states for safety or medical reasons remains permitted, which covers fatigue and alertness detection in a driver. Inferring mood, stress, or emotional state from a driver’s face does not fall under it. If you are evaluating an in-cab AI camera, ask the vendor precisely what the system infers and from what.
EU: GDPR, consent and works councils
Driver monitoring data is personal data. You need a lawful basis (legitimate interest is the usual one, and it requires a documented balancing test), a defined retention period, and transparency about what is collected and who sees it. In several EU countries, Germany among them, works councils have co-determination rights over employee monitoring systems; introducing one without agreement can invalidate the whole deployment after you have paid for it.
EU: the assessment you are legally required to run first
Systematic monitoring of employees triggers Article 35 of the GDPR, which means a Data Protection Impact Assessment before the system goes live, not after. Driver monitoring sits squarely inside the trigger: it is systematic, it concerns employees who cannot meaningfully refuse, and once in-cab cameras are involved it processes biometric data. Several national supervisory authorities list workplace monitoring and vehicle telematics among the processing types that require a DPIA by default.
In practice the DPIA is a document that records what you collect, on what lawful basis, why less intrusive options would not achieve the same result, who has access, how long data is kept, and what you did to reduce the impact on drivers. If the assessment concludes the residual risk is still high, you have to consult your supervisory authority before starting.
Two things make this worth doing properly rather than as paperwork. It is the first thing a regulator asks for if a driver complains, and running it early tends to surface design decisions that are expensive to change once the system is deployed: retention periods, who sees footage, whether the camera records continuously or only on events.
US: state biometric and recording law
Federal rules are not where your camera exposure sits. Illinois BIPA is. It requires written notice and a signed release before you collect biometric identifiers such as a scan of face geometry, and it carries a private right of action with statutory damages per violation, which is what turns a compliance oversight into a class action.
This is not theoretical. A BIPA class action over driver-facing cameras ran for three years in the Northern District of Illinois after the court refused to dismiss it in 2022, went through full expert discovery, and ended in a class-wide settlement in 2025. The exposure sits with you rather than with your vendor, and BIPA Section 15(b) is why: it puts the obligation on whoever collects the biometric identifier.
Texas CUBI and Washington have their own biometric regimes, and other states have followed. Audio is a separate trap: a number of states require all-party consent to record a conversation, so a camera capturing cabin audio can be lawful in one state and unlawful in the next one the truck enters. Most platforms let you disable audio capture, and for interstate operations that is usually simpler than tracking consent rules state by state.
Neither biometric nor recording law depends on where your company is headquartered. What matters is where the driver and the vehicle are.
US: CSA, ELD and hours of service
Behavior data feeds the Unsafe Driving category of the FMCSA Safety Measurement System, which affects intervention priority and, indirectly, what you pay for insurance. In a November 2024 Federal Register notice, FMCSA finalized the biggest overhaul of SMS since 2010: 959 roadside violations consolidated into 116 violation groups, severity weights simplified from a 1-10 scale to 1 or 2, BASICs renamed compliance categories, and proportionate percentiles replacing safety event groups. FMCSA has said a follow-up notice will announce the launch date. As of August 2026, it has not been published, and the public SMS website still shows the existing BASIC structure, so trade coverage describing the new system as already live is ahead of the agency. ELD and hours-of-service rules are separate obligations, though most telematics platforms handle them alongside behavior monitoring.
The common thread across all of this: none of it is expensive to get right at the design stage, and all of it is expensive to retrofit.
Step 10: Review and improve the system regularly

The job doesn’t stop once your DBMS is up and running. Over time, you’ll want to:
- Audit the system: Make sure everything’s running smoothly and look for ways to improve.
- Review driver performance: Use the data to guide driver reviews and identify opportunities for improvement.
- Update hardware and software: firmware and detection models improve, and older devices lose support.
Current trends and future of driver behavior monitoring systems

Three forces are reshaping this market at once, and they point in the same direction.
Regulation: new vehicles arrive with monitoring already fitted
The biggest shift is not a feature, it is a mandate. Every new vehicle registered in the EU from July 2026 ships with a distraction warning system under the General Safety Regulation, joining the drowsiness warning requirement already in force. What that system physically is varies by manufacturer, and whether it exposes a data feed varies too, but the decision to have one is no longer the fleet’s to make. That changes the question fleets ask: not whether to add driver monitoring, but how to integrate what arrives with the vehicle into the scoring and coaching you already run. US fleets should not assume distance from this. Global platforms are built once, and industry coverage expects the hardware to cross the Atlantic.
The second regulatory vector is accountability. The EU AI Act bans inferring emotions from biometric data in the workplace, and GDPR Article 22 limits decisions about people made solely by automated processing. The direction is unambiguous: a score needs an audit trail, an explanation, and a human holding the decision.
Technology: from recording what happened to predicting what might
The generational change is the move from documenting what happened to estimating what is about to. Platforms increasingly compute forward-looking risk from fatigue patterns, time of day and route history, and intervene before the event rather than after.
Three things make that work. Edge AI processes video on the camera itself, which shortens the loop from “a manager reviews footage tomorrow” to “the driver gets a cue in seconds”, works without connectivity, and answers the privacy objection because footage does not leave the cab unless an event is triggered. Multimodal fusion scores an event from video, following distance, and context together rather than from an accelerometer alone, which is what makes event validation the default instead of the exception. And an agentic layer is appearing on top of coaching: the system selects who needs attention, assembles the session from footage and history, and filters false positives, leaving the conversation itself to a human.
Economics: monitoring becomes a reward, not a punishment
Two market forces are rewriting how these systems are sold. Insurance is moving to the meter, with carriers tying premiums directly to telematics scores and repricing on a weekly basis rather than at annual renewal, which turns the safety score from an internal metric into a financial document. And the driver shortage has flipped the pitch from surveillance to retention: recognition programs, safe-mile bonuses, scoreboards drivers actually want to be on, because replacing a driver costs more than any telematics subscription.
The honest footnote is that drivers still push back on inward-facing cameras, and vendors now compete on privacy modes, event-only recording, on-device processing and lens covers, as much as on detection accuracy.
Where all three lead
Follow all three, and they land in the same place. The score stops being a private number on a manager’s dashboard and becomes something a driver can appeal, an insurer can price, and a regulator can audit. Fleets that build their scoring around explainability now are not being cautious, they are building the version of the system that all three of these trends are about to require.
How Volpis builds driver behavior monitoring systems
We built Rand One for Rand McNally, a company that has been guiding drivers since 1856 and knows fleet hardware better than almost anyone. The app includes a driver score and logbook that flags speeding and harsh driving, and lets managers filter trip data by classification and time period. The point of the project was to deliver hardware-level tracking precision through software alone, with no installation and no external devices. We shipped the MVP in six months, and the apps are live on the App Store and Google Play. The partnership is now in its third year.
One design decision from that project is worth borrowing whatever you build. The Hours of Service tracker records location only while the driver is On Duty. Switch to Off Duty and tracking stops automatically. That is Step 9 built into the product rather than bolted on afterwards, and it is the kind of choice that is cheap at the design stage and expensive to retrofit.
It is also the clearest example of what the build-vs-buy decision in Step 3 looks like in practice: Rand McNally already had proven fleet hardware, and still chose to build the software version rather than buy one.

Read more reviews from our valuable customers here
We invite you to explore our portfolio for a detailed look at the innovative software systems we have developed for our clients.
Our team understands the nuances of the fleet management industry and is committed to providing solutions that are tailored to your unique goals. If you are weighing whether to buy or build driver behavior monitoring for your fleet, we are happy to talk it through including telling you when off-the-shelf is the better answer. Reach us at info@volpis.com.
Questions & Answers
FAQ
What is driver behavior monitoring?
Driver behavior monitoring is the practice of tracking and analyzing how drivers handle their vehicles, using telematics devices, sensors and, increasingly, cameras. It captures events such as speeding, harsh braking, sharp cornering and distraction, and turns them into patterns a fleet manager can act on through coaching, training or route changes.
What is driver behavior management?
Monitoring is the measurement; management is what you do with it. Driver behavior management covers the targets you set, the coaching conversations you run, the incentives you attach to scores, and the training you assign when a pattern shows up. A system with no management process around it produces reports nobody reads.
What does a driver monitoring system do?
A driver monitoring system watches the driver rather than the driving. It tracks eye movement, head position and attention, usually through an in-cab camera, and warns when it detects drowsiness or distraction. EU rules do not mandate a DMS as such. What became mandatory on all new vehicles registered from July 2026 is a distraction and drowsiness warning function, which manufacturers can implement with a camera or from steering input, so what is actually fitted varies by model.
How do you monitor your driver?
Through a combination of telematics hardware (GPS, accelerometer, diagnostic port devices), optional cameras, and software that turns raw events into scores and alerts. What separates a working setup from an expensive one is not the hardware but the order you do things in, which the ten-step section above covers in full.
How is a driver safety score calculated?
Most platforms start from a baseline of 100 and subtract weighted penalties for detected events, with heavier weights on behaviors that predict crashes most strongly. The part most fleets get wrong is normalization: a fair score is expressed per distance or per hour driven, not as a raw event count. The section above walks through the calculation with worked numbers.
How long does it take to see results?
It depends on which number you are watching. Harsh events and speeding per 1,000 km respond within weeks, because drivers change what they do as soon as they can see it. Fuel economy needs a full year to compare cleanly, since seasonal variation is larger than the coaching effect. Brake and tire wear can take 18 to 36 months on some duty cycles. Judge the program on the fast indicators early and the slow ones later.
Is it legal to monitor drivers with in-cab cameras?
In the EU, yes for safety purposes: fatigue and attention detection is explicitly permitted. What is prohibited, since February 2025 under the EU AI Act, is inferring emotions from biometric data in a workplace, and employee consent does not make it lawful. You will also need a lawful basis under GDPR, a retention policy, driver transparency, a Data Protection Impact Assessment before launch, and in some countries works council agreement. US rules vary by state, particularly on audio recording.
How much does a driver behavior monitoring system cost?
Cost comes in four parts: hardware per vehicle, a monthly software subscription per vehicle, installation, and integration with systems you already run. Vendors rarely publish list prices, but public procurement records do. Barnsley Metropolitan Borough Council awarded a four-year telematics contract covering around 400 vehicles at £423,655, which works out at roughly £22 per vehicle per month for a mixed fleet without cameras. US fleets have an equivalent route: cooperative purchasing agreements through Sourcewell and NASPO ValuePoint, and the council and county records that reference them, show what comparable agencies actually agreed to pay. Figures checked August 2026.
Treat any of this as an order of magnitude rather than a quote. Fleet size, contract length, camera requirements, and integration scope move the number more than the sticker rate does. Ask three vendors to quote your exact vehicle count and camera requirement, and ask each for the five-year total rather than the monthly rate. That is where off-the-shelf and custom actually diverge.